
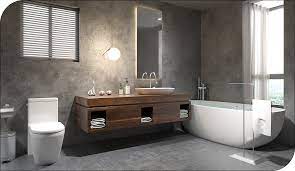
Kitchen And Bathroom Jun Kitchen And Bathroom Headlines
Since August, listed sanitary ware enterprises or enterprises related to sanitary ware have been released 2021 first half-year report. С комплексной точки зрения, most enterprises in the first half of the year have achieved double growth in operating income and net profit, and the increase is mostly in double digits. The net profit of Oppein Home and Chenglin increased by more than 100%. Apparently, in the first half of last year, bathroom companies were affected by the epidemic, resulting in a lower benchmark for comparison. Apparently, in the first half of last year, bathroom companies were affected by the epidemic, resulting in a lower benchmark for comparison. This is one of the reasons for the larger year-on-year growth in the business. Однако, from the description of each financial report, the overall rebound in consumption in the first half of the year and the continued improvement in the building materials industry is an objective fact.
Revenue and net profit data of some sanitary ware-related enterprises in the first half of the year.
| Company abbreviation | Операционная прибыль (миллиард юаней) | Увеличение/уменьшение в годовом исчислении | Чистая прибыль (миллиард юаней) | Увеличение/уменьшение в годовом исчислении |
| Ванная комната Хуида | 17.43 | 32.38% | 1.12 | -12.94% |
| Solux Home | 12.02 | 43.87% | 1.36 | 22.63% |
| р&Т | 8.03 | 73.99% | 0.59 | 31.51% |
| Цзяньлинь Дом | 22.94 | 41.29% | 2.01 | 20.59% |
| Оппеин Дом | 82.00 | 65.14% | 10.12 | 106.98% |
| Chenglin | 22.89 | 27.22% | 0.31 | 157.04% |
| ХГЧ | 5.89 | 5.18% | 0.13 | / |
Сантехника Хуида
First half revenue reached 1.743 миллиард юаней
Overall bathroom revenue up 370.95%
Huida Sanitary Ware released its half-yearly report on the evening of August 19. В январе-июне, Huida bathroom achieved operating revenue of 1.743 миллиард юаней, увеличение 32.38%. Чистая прибыль, причитающаяся акционерам листинговой компании, составила 112 миллион юаней, вниз 12.94% год за годом. The rate of decline expanded compared to the same period last year. Earnings per share were RMB0.29, down from RMB0.35 in the same period last year. For revenue growth, Huida said it was due to increased sales, but did not explain the reason for the decline in net profit.
Единица: Юань Валюта:юаней
| Key accounting data | Текущий отчетный период
(январь-июнь) |
Тот же период предыдущего года | For the current reporting period compared to the previous year Increase or decrease (%) |
| Операционная прибыль | 1,743,43& 493. 95 | 1,316, 961,738. 98 | 32. 38 |
| Чистая прибыль, принадлежащая акционерам листинговой компании | 111,79& 507. 60 | 12& 413,150. 82 | -12. 94 |
| Чистая прибыль после чрезвычайных прибылей или убытков, принадлежащих акционерам листинговой компании | 91,179,512.71 | 117, 722,900. 25 | -22. 55 |
| Чистый денежный поток от операционной деятельности | -136,835, 760. 20 | 314,271,596.51 | -143.54 |
По категориям, sanitary ceramics still occupy the bulk of the first half of the contribution to revenue accounted for 51.82% от общего дохода. As one of the sub-categories of sanitary ceramics, the overall bathroom revenue increased by 370.95% по сравнению с аналогичным периодом прошлого года. The category now accounts for 3.18% от общего дохода, showing great potential for development. Кроме того, all other categories recorded double-digit revenue growth, with smart sanitary ware increasing by 102.24%.
Единица: миллион юаней
| Область | Выручка от основной деятельности в отчетном периоде | Изменение в годовом исчислении | Процент от основного дохода от бизнеса | |
| Внутренние продажи | Розничный канал | 90, 06& 12 | 51. 14% | 52. 11% |
| Инженерный канал | 42, 135.41 | 23. 52% | 24. 38% | |
| Итого | 132, 203. 53 | 41.09% | 76. 48% | |
| Зарубежные продажи | 40,647. 66 | 10. 55% | 23. 52% | |
| Общий доход от основного бизнеса | 172,851.19 | 32.48% | 100.00% | |
- Revenue contribution by product
Единица: миллион юаней
| Категории продукта | Выручка от основной деятельности в отчетном периоде | Изменение в годовом исчислении | Процент от основного дохода от бизнеса |
| Сантехническая керамика | 89, 577. 08 | 23. 72% | 51.82% |
| Среди них: intelligent sanitary ware | 18. 873. 43 | J02. 24 | J0. 92% |
| Общая сантехника | 5, 489. 53 | 370. 95% | 3. 18% |
| Плитка | 23, 673. 07 | 54. 97% | 13. 69% |
| Ванная комната | 6, 233. 47 | 57. 48% | 3.61% |
| Bathroom cabinet | 13, 097. 35 | 4& 86% | 7. 58% |
| Аппаратное обеспечение Сантехника | 29, 105. 53 | 39. 73% | 16. 84% |
| Другие | 11, 164. 69 | 21.28% | 6. 46% |
| Общий доход от основного бизнеса | 172,851.19 | 32. 48% | 100.00% |
Solux Home
Revenue increased by 43.87% к $1,202 миллион
Nine large self-operated brand experience centres in the pipeline
According to Solux Home’s semi-annual report released on 23 Август, с января по июнь, Solux Home achieved revenue of 1.202 миллиард юаней, увеличение 43.87% год за годом. Net profit attributable to shareholders of the parent company was RMB136 million, увеличение 22.63% год за годом. Basic earnings per share were RMB0.34, up from RMB0.28 in the same period last year.
Единица: Юань Валюта: юаней
| Key accounting data | Текущий отчетный период
(январь – Июнь) |
Тот же период предыдущего года | Current reporting period over the same period of the previous year Increase/decrease (%) |
| Операционная прибыль | 1, 201,673,867.78 | 835,237,800. 60 | 43. 87 |
| Чистая прибыль, принадлежащая акционерам листинговой компании | 135,541,912.06 | 110, 527,041.54 | 22. 63 |
| Чистая прибыль после чрезвычайных прибылей или убытков, принадлежащих акционерам листинговой компании | 121,537,117.72 | 110,862, 785. 75 | 9. 63 |
| Чистый денежный поток от операционной деятельности | 74, 013,835. 56 | 9& 308,176. 65 | -24.71 |
| At the end of the reporting period | Конец предыдущего года | Increase or decrease at the end of the reporting period over the end of the previous year (%) | |
| Чистые активы, принадлежащие акционерам листинговых компаний | 2,060,510,376.81 | 2,006, 350,869. 61 | 2. 70 |
| Всего активов | 3, 185,345,127.08 | 2,721,453, 526. 52 | 17. 05 |
В первой половине года, Solux accelerated its presence in the beauty and health category and the home category. За отчетный период, было 22 new patent applications in the beauty and health category, включая 5 патенты на изобретения. In the Home category, 8 new patents were applied for, включая 2 inventions. A number of products were also shortlisted and won awards in top international or domestic design competitions. In terms of terminals, Solux said that the second “Solux-Home” large experience centre has been opened in Quanzhou. Nine large self-operated brand experience centres in Fuzhou and Putian are in the pipeline.
р&Т
Revenue up 74%, a new high since IPO
Smart bathroom nearly doubles
In the evening of 16 Август, р&T released its half-yearly report for 2021. С января по июнь, р&T achieved revenue of $803 миллион, вверх 73.99% от $462 million in the same period the previous year. This continued the growth trend seen since the second half of last year and was the highest since its IPO in 2016. С точки зрения прибыли, р&T achieved a net attributable profit of $59 миллионов в первом полугодии, увеличение 31.51% год за годом. Basic earnings per share were RMB0.14, увеличение 27.27%.
| Текущий отчетный период | Тот же период предыдущего года | Increase or decrease in the current reporting period over the same period of the previous year | |
| Operating revenue (юань) | 803,319,911.67 | 461,716,871.43 | 73.99% |
| Чистая прибыль, принадлежащая акционерам листинговой компании (юань) | 59,249,967.92 | 45,052,622.53 | 31.51% |
| Чистая прибыль после чрезвычайных прибылей или убытков, принадлежащих акционерам листинговой компании (юань) | 49,867,702.34 | 36,688,012.59 | 35.92% |
| Чистый денежный поток от операционной деятельности (юань) | 63,883,452.60 | 113,847,608.12 | -43.89% |
| Базовая прибыль на акцию (юань/акция) | 0.14 | 0.11 | 27.27% |
| Разводненная прибыль на акцию (RMB/share) | 0.14 | 0.11 | 27.27% |
| Средневзвешенная доходность чистых активов | 2.91% | 2.70% | 0.21% |
| At the end of the reporting period | Конец предыдущего года | Increase at the end of the reporting period over the end of the previous year Decrease | |
| Всего активов (юаней) | 2,134,768,31705 | 2,089,487,820.67 | 2.17% |
| Net assets attributable to shareholders of the listed company (юаней) | 1,683,574,523.59 | 1,683,177,962.40 | 0.02% |
According to publicly available data, р&T’s revenue in the smart toilets and covers category reached RMB338 million in the first half of the year, вверх 96.36% from RMB172 million in the first half of 2020, nearly doubling. В то же время, the category’s revenue share of total revenue was also increasing, что составляет примерно 42.06% в первой половине года, only slightly lower than the 45.89% of the water tanks and accessories category.
Цзяньлинь Дом
Operating revenue of approximately RMB2.3 billion in the first half of the year
Established a subsidiary to lay out engineering channels
В первой половине года, Jianlin Home achieved double-digit growth in both revenue and net profit, with revenue increasing by 41.29% to RMB2.294 billion. Its net profit grew by 20.59% to RMB201 million. Its basic earnings per share also increased by 7.14% to RMB0.45.
Единица: RMB million Currency: юаней
| Key accounting data | Текущий отчетный период
(январь – Июнь) |
Тот же период предыдущего года | Increase or decrease in the current reporting period over the same period of the previous year (%) |
| Операционная прибыль | 229, 402. 24 | 162, 359. 59 | 41.29 |
| Чистая прибыль, принадлежащая акционерам листинговой компании | 20,105. 22 | 16, 672. 77 | 20. 59 |
| Чистая прибыль после чрезвычайных прибылей или убытков, принадлежащих акционерам листинговой компании | 17,853. 22 | 15, 372. 34 | 16. 14 |
| Чистый денежный поток от операционной деятельности | 4,975. 09 | 23, 599. 52 | -78. 92 |
| At the end of the reporting period | Конец предыдущего года | Increase/decrease (%) at the end of the current reporting period compared to the end of the previous year | |
| Net assets attributable to shareholders of the listed company | 242,079. 37 | 237,716. 50 | 1.84 |
| Всего активов | 403, 726. 02 | 376, 767. 96 | 7. 16 |
During the January to June period, Jianlin Home’s overseas business grew steadily. Revenue from the overseas market was RMB1.805 billion, вверх 39.89% год за годом, учет 79.28% of the company’s main business revenue. The Company also accelerated the process of promoting its business in the China market. В первой половине года, the main business revenue from the China market was RMB472 million, что представляет собой увеличение в годовом исчислении на 47.12% and accounting for 20.72% of the company’s main business revenue. It was revealed that in the first half of the year, Jianlin Home established Shanghai Jianlin Smart Home Technology Co Ltd to focus on the real estate finishing market. It will subsequently do more scheming and planning in the real estate finishing track to further promote the speeding up of real estate and engineering channel expansion.
Оппеин Дом
Revenue increased by 65% to RMB8.2 billion
Multiple indicators show triple-digit growth
According to Oppein Home’s performance report released on 12 Август, the company’s revenue in the first half of the year was RMB8.2 billion, увеличение 65.14% год за годом. Net profit attributable to shareholders of the listed company increased by 106.98% to RMB 1.012 миллиард. Basic earnings per share doubled from the same period last year to RMB1.67.
Единица: миллионов юаней
| Проекты | Текущий отчетный период | Тот же период предыдущего года | Increase or decrease (%) |
| Total operating revenue | 820,017.95 | 496,553.87 | 65.14 |
| Операционный доход | 119,176.01 | 56,880.43 | 109.52 |
| Общая прибыль | 120,426.17 | 56,805.68 | 112.00 |
| Чистая прибыль, принадлежащая акционерам листинговой компании | 101,236.45 | 48,910.53 | 106.98 |
| Чистая прибыль после чрезвычайных прибылей или убытков, принадлежащих акционерам листинговой компании | 94,532.12 | 44,265」9 | 113.56 |
| Базовая прибыль на акцию (юаней) | 1.67 | 0.83 | 101.20 |
| Средневзвешенная доходность чистых активов | 8.14% | 4.99% | Increase of 3.15 процентные пункты |
For the performance growth, Oppein Home pointed out three aspects, one is that the company opened up a new sales path in the industry with the integration sales model of custom core + ancillary products + door and wall system, which has achieved rapid growth in wardrobe performance. Второй, the whole house has gradually entered the fast lane of development, with the mature use of the company’s information technology tools, and has driven the rapid growth in the performance of custom products, ancillary products, installed materials and other categories. В-третьих, it has activated the retail dealers to carry out business cooperation with local decoration enterprises, deeply promoted the “whole kitchen customization” модель, tapped the potential of the old kitchen renovation, and boosted the steady growth of the cabinet retail performance. In the flash report, Oppein Home did not disclose sales figures related to the bathroom category.
Chenglin
Operating revenue achieved in the first half of the year was approximately RMB2.3 billion
Growth of approximately 15% in mainland China
According to Chenglin’s first-half financial results, the company achieved operating revenue of NT$9.868 billion (approximately RMB2.289 billion) с января по июнь, увеличение примерно на 27.22% год за годом. Net profit attributable to the mother company was NT$134 million (approximately RMB31 million), compared to a loss of NT$48 million in the same period last year, увеличение примерно на 157.04% год за годом.
| 21. Operating income110 | 110.4.1-110.6.30 | 109.4.1-109.6.30 | 110.1.1-110.6.30 | 109.1.1-109.6.30 |
| Revenue from customer contracts
Revenue from merchandise sales Less: Sales returns and discounts |
$5,278,101
(411.787) |
$3,707.790
(300,829) |
$10,676,511
(808,101) |
$7,818,767
(636,270) |
| Общий | $4,866,317 | $3,406,961 | $9,868,410 | $7,182,497 |
Chenglin’s main markets are Taiwan, Китай, the Americas and Europe. В первой половине года, the operating revenues of the four major markets were NT$1,169 million, NT$85 million, NT$4,827 million and NT$3,788 million respectively. The European and US markets accounted for the bulk of sales. It is worth noting that the Mainland China market, which had operating revenue of NT$55 million last year, grew by approximately 15% в первой половине этого года.
ХГЧ
Operating income of approximately NT$589 million in the first half of the year
According to HCG’s first-half report released on 10 Август, the company achieved operating revenue of NT$2.538 billion (approximately RMB589 million) с января по июнь, увеличение 5.18% год за годом. Net profit attributable to the mother company was NT$57 million (approximately RMB13 million). ХГЧ, which celebrated its 90th anniversary this year, participated in the Shanghai Kitchen & Bath Show during the year. It displayed a one-stop experience hall for smart public toilets, intelligent sanitary ware, medical sanitary ware and elderly-friendly sanitary ware grade products, which showed the new vitality of the old brand.
| 1 . Date of submission of financial report to or resolution by the Board of Directors:110/08/10
2. date of approval of the financial report by the Audit Committee:110/08/10 3. the date when the financial report was reported (XXX /XX /XX~XXX /XX/XX^110/01/0U110/06 /30) 4. Accumulated operating revenue for the period from January 1 to the current period (in thousands): $2538151 5. Accumulated operating profit (gross loss) for the period from January 1 to the end of the period (in thousands):638586 6. Accumulated operating income (потеря) for the period from January 1 to the end of the period (in thousands):42526 7. Accumulated net income (потеря) before income tax for the period ended January 1 (in thousands):84396 8. Accumulated net income (потеря) for the period from January 1 to the end of the current period (in thousands):51504 9. Accumulated net income (потеря) attributable to owners of the parent company for the period ended January 1 (in thousands):56758 10. Basic earnings (потеря) per share for the period from January 1 to the end of the period (NT$):0.15 11. Total assets at the end of the period (in thousands):10711581 12 . Total liabilities at the end of the period (in thousands):4659094 13. Equity attributable to owners of the parent company as of the end of the period (in thousands):5994973 14 – Other disclosures: None |
|
| Описание | |
